Regional Workforce
Morgan County draws additional labor force from the surrounding region. For more specific regional workforce information, contact the MCEDA office at 256-353-1213.
Regional Workforce (Region 1 as of November 2024)
| County |
Civilian Labor Force |
Unemployment |
Unemployment Rate |
| Morgan County |
63,032 |
1,700 |
2.7% |
| Colbert County |
24,619 |
900 |
3.7% |
| Cullman County |
40,784 |
1,159 |
2.8% |
| Dekalb County |
30,806 |
963 |
3.0% |
| Lawrence County |
15,282 |
485 |
3.2% |
| Limestone County |
51,643 |
1,511 |
2.9% |
| Madison County |
212,760 |
5,962 |
2.8% |
| Marshall County |
46,997 |
1,294 |
2.8% |
| Winston County |
10,015 |
391 |
3.9% |
| Franklin County |
14,679 |
478 |
3.3% |
| Jackson County |
23,692 |
787 |
3.3% |
| Lauderdale County |
44,373 |
1,476 |
3.3% |
| Marion County |
12,998 |
491 |
3.8% |
| TOTAL |
592,680 |
17,597 |
3.0% |
Unemployment Rates
| |
Morgan County |
Decatur MSA |
| Jul-24 |
2.5% |
2.6% |
| Jan-24 |
2.6% |
2.7% |
| Jul-23 |
1.8% |
1.9% |
| Jan-23 |
2.0% |
2.1% |
| Jul-22 |
2.6% |
2.6% |
| Jan-22 |
2.6% |
2.7% |
| Jul-21 |
2.5% |
2.6% |
| Jan-21 |
2.9% |
3.0% |
| Jul-20 |
6.3% |
6.4% |
| Jan-20 |
2.8% |
2.9% |
| Jul-19 |
2.6% |
2.7% |
| Jan-19 |
3.8% |
4.0% |
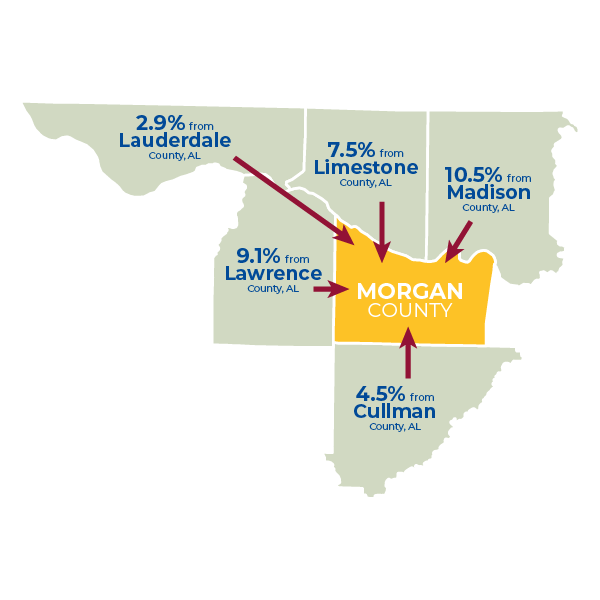
Top Five Counties Sending Workers
| Madison County |
5,412 |
| Lawrence County |
4,713 |
| Limestone County |
3,882 |
| Cullman County |
2,352 |
| Lauderdale County |
1,507 |
Source: U.S. Census Bureau, OnTheMap Application Employment Statistics (2022).
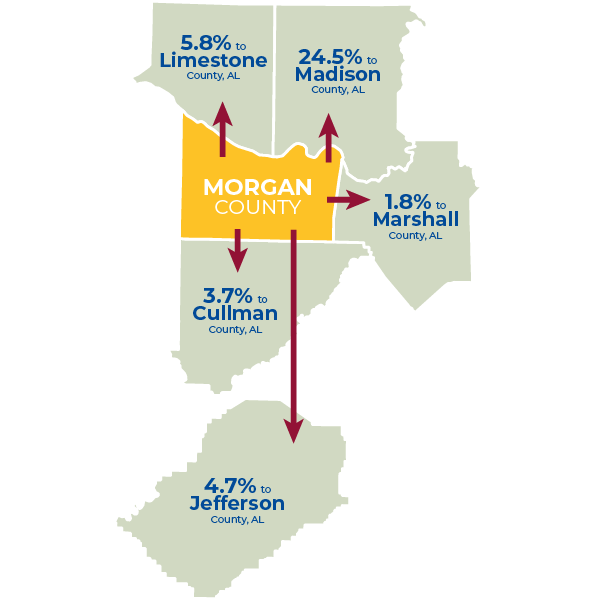
Top Five Counties Receiving Workers
| Madison County |
12,414 |
| Limestone County |
2,932 |
| Jefferson County |
2,393 |
| Cullman County |
1,860 |
| Marshall County |
903 |
Source: U.S. Census Bureau, OnTheMap Application Employment Statistics (2022).
Regional Workforce Resources
To learn more about the regional workforce, visit:


